c64-binary-analyzer
A downloadable tool
# C64 Binary Analyzer
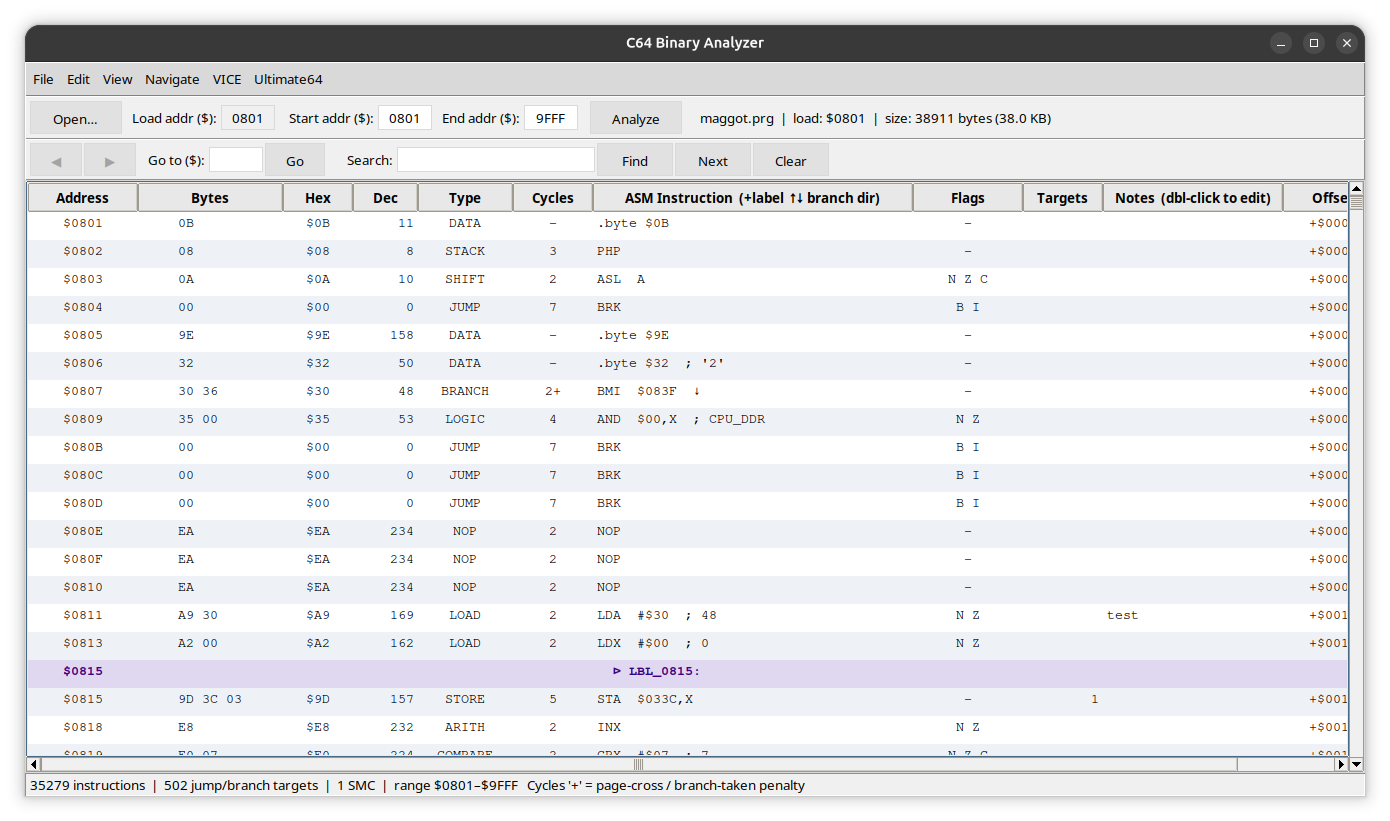
A cross-platform disassembler and reverse-engineering tool for **Commodore 64** machine code, written in Python with a tkinter GUI.
Supports loading `.prg`, `.bin`, and `.d64` disk image files, providing a fully interactive disassembly table with patching, labelling, bookmarks, VICE integration, and more.
## Requirements
- Python 3.10 or newer
- tkinter (included in most Python installations; on Ubuntu/Debian install with `sudo apt install python3-tk`)
- [VICE](https://vice-project.sourceforge.io/) emulator (optional, for in-emulator testing)
## Installation & Running
cd binary-analyzer
python3 analyzer.py
Optionally pass a file directly on the command line:
python3 analyzer.py myprogram.prg
python3 analyzer.py game.d64
## File Format Support
| `.prg` | Commodore 64 program file. The first two bytes are the load address (little-endian) and are read automatically. |
| `.bin` | Raw binary. No embedded load address — enter the base address manually in the **Load addr** field. |
| `.d64` | 1541 floppy disk image. A file picker dialog lists all PRG files on the disk; select one to load it. |
## Disassembly Table Columns
| Column | Description |
| **Address** | Memory address of the instruction in hex (`$XXXX`) |
| **Bytes** | All raw bytes of the instruction in hex, padded to fixed width |
| **Hex** | Opcode byte as `$XX` |
| **Dec** | Opcode byte as decimal |
| **Type** | Instruction category: `LOAD`, `STORE`, `ARITH`, `LOGIC`, `SHIFT`, `COMPARE`, `BRANCH`, `JUMP`, `STACK`, `TRANSFER`, `STATUS`, `NOP`, `DATA`, `SMC!` |
| **Cycles** | CPU cycle count. `+` means a page-crossing or taken-branch adds extra cycles |
| **ASM** | Disassembled instruction. Includes C64 hardware label comments (e.g. `STA $D020 ; VIC_BORDER`) and branch direction arrows (`↑` backward / `↓` forward) |
| **Flags** | CPU status flags modified by this instruction (`N`, `V`, `Z`, `C`, etc.) |
| **Targets** | Number of other instructions that jump or branch to this address. Click to open a reference popup |
| **Notes** | Your own annotation. Double-click to edit |
> **Right-click any column header** to show/hide individual columns.
---
## Loading a File
1. Click **Load File…** and select a `.prg`, `.bin`, or `.d64` file.
2. For `.prg` files the load address is read automatically and locked.
3. For `.bin` files enter the base address in the **Load addr ($)** field.
4. For `.d64` files a dialog lists all PRG files on the disk — double-click or select and press **Load**.
5. Enter optional **Start** and **End** addresses (hex) to limit the disassembly range. Useful for large files.
6. Click **Analyze** (or press Enter in any address field) to (re-)populate the table.
---
## Navigation
### Arrow keys
Use **↑ / ↓**, **Page Up / Page Down**, **Home / End** to move through the table. The view always scrolls to keep the selected row visible.
### Go to address
Type a hex address in the **Go to ($)** field and press Enter or click **Go** to jump directly to that row.
### Back / Forward history
Every navigation action (Go-to, jump-reference click, search) is pushed onto a history stack. Use the **◀** and **▶** buttons to move back and forward.
### Follow a jump
**Double-click the ASM column** of any `JMP`, `JSR`, `BEQ`, `BNE`, or other branch/jump instruction to navigate directly to its target address.
## Search
1. Type any text in the **Search** field and press Enter or click **Find**.
2. All matching rows (searched across the ASM and Notes columns) are highlighted in blue.
3. Use **Next** to cycle through matches. The counter shows `Match N / Total`.
4. Click **Clear** to remove highlights.
## Jump Reference Popup
When a row shows a non-zero number in the **Targets** column, **single-click** that number to open the jump reference window.
- Lists every instruction in the disassembly that jumps or branches to this address.
- **Single-click** an entry to navigate the main table to that source instruction (the popup stays open).
- **Close** dismisses the popup.
## Auto-Labels
Every address that is the target of a `JSR`, `JMP`, or branch automatically receives a label:
- `SUB_XXXX` — for addresses reached by `JSR` (subroutines)
- `LBL_XXXX` — for addresses reached by `JMP` or branch instructions
Labels appear as highlighted rows above the instruction they name. They are also used in the **Export** output.
### Custom labels
**Right-click** any instruction row → **Set label…** to assign your own name. Custom labels override auto-generated ones and are saved to `~/.c64analyzer.json`.
## Bookmarks
**Right-click** any row → **Add bookmark…** to save a named address for quick access.
- Open the **Bookmarks** panel from the search bar to see all bookmarks.
- **Single-click** a bookmark entry to navigate to it.
- **Remove selected** deletes a bookmark.
Bookmarks are saved to `~/.c64analyzer.json` and persist across sessions.
## Notes
**Double-click the Notes column** of any row to type a free-text annotation. Notes are saved automatically to a JSON sidecar file alongside the loaded binary (e.g. `game.prg.notes.json`) and are restored the next time the same file is opened.
## Byte Patching
You can edit the binary directly within the tool.
1. **Double-click the Bytes, Hex, or Dec column** of any instruction row.
2. A dialog shows the current bytes pre-filled (e.g. `A9 42`).
3. Type replacement hex bytes separated by spaces and press OK.
4. The table re-disassembles immediately. Patched rows are highlighted in **green**.
5. The window title shows `● N byte(s) patched` while there are unsaved changes.
**Save PRG…** — writes the modified binary (with load address header) to a new `.prg` file.
**Reset** — discards all patches and restores the original data (asks for confirmation).
## Self-Modifying Code Detection
Any `STA`, `STX`, or `STY` instruction whose target address falls within the loaded code range is automatically flagged. These rows are highlighted in **orange** and categorised as `SMC!` in the Type column.
## PETSCII Hints
Data bytes (unknown opcodes shown as `.byte $XX`) that contain printable PETSCII characters display the character as a comment: `.byte $41 ; 'A'`.
## Statistics
Click **Stats** to open a statistics popup showing:
- Total instruction count
- Number of unique jump/branch targets
- Number of auto-labels and self-modifying code sites
- Instruction count broken down by category (with a bar chart)
- Top subroutines by `JSR` call count
## Export Disassembly
Click **Export…** to save the disassembly as a plain-text `.asm` file.
- Auto-labels are written as proper labels (e.g. `SUB_C000:`)
- Notes appear as inline comments
- Jump reference counts are noted where no note is present
## VICE Emulator Integration
Click **▶ VICE** to launch the currently loaded program directly in the VICE C64 emulator.
- VICE is located automatically via `PATH` or common install directories.
- If not found, a file browser opens to locate the executable — the path is saved.
- The current binary (with all patches applied) is written to a temporary `.prg` file and started with `-autostart`.
### Breakpoint on launch
Enter a hex address in the **BRK ($):** field next to the VICE button. VICE will halt at that address via its monitor command interface.
## C64 Hardware Labels
The following memory regions are automatically annotated in the ASM column:
| `$D000–$D02E` | VIC-II (video chip) registers |
| `$D400–$D418` | SID (sound chip) registers |
| `$D800` | Color RAM |
| `$DC00–$DC0F` | CIA1 (keyboard/joystick/timers) |
| `$DD00–$DD0F` | CIA2 (serial bus/user port) |
| `$FF81–$FFF3` | KERNAL jump table (`CHROUT`, `LOAD`, `SAVE`, etc.) |
| `$FFFA–$FFFF` | Hardware interrupt vectors |
| `$0314–$0327` | Kernal indirect vectors (IRQ, NMI, OPEN, etc.) |
## Flags Tooltip
Hover over any cell in the **Flags** column to see an explanation of each flag the instruction modifies:
N — Negative bit 7 of result = 1
Z — Zero result = 0
C — Carry unsigned overflow / borrow
## Dark Mode
Click **🌙 Dark** in the top-right of the toolbar to switch to a dark colour scheme. Click **☀ Light** to switch back. The preference is saved in `~/.c64analyzer.json`.
## Keyboard Shortcuts
| Key | Action |
| `↑` / `↓` | Move row selection |
| `Page Up` / `Page Down` | Scroll one page |
| `Home` / `End` | First / last row |
| `Enter` (in Go-to field) | Navigate to address |
| `Enter` (in Search field) | Find next match |
| `Double-click` ASM column | Follow jump/branch to target |
| `Double-click` Bytes/Hex/Dec | Edit (patch) bytes |
| `Double-click` Notes column | Edit note |
| `Right-click` row | Context menu (bookmark, label) |
| `Right-click` column header | Toggle column visibility |
## Configuration
Settings are stored in `~/.c64analyzer.json`:
- VICE executable path
- User-defined labels
- Bookmarks
- Column visibility
- Dark mode preference
Notes are stored as sidecar files next to the loaded binary (e.g. `game.prg.notes.json`).
| Published | 21 hours ago |
| Status | In development |
| Category | Tool |
| Author | Andre4s |
| AI Disclosure | AI Assisted, Code, Graphics |
Download
Click download now to get access to the following files:
Development log
- c64 binary analyzer21 hours ago

Leave a comment
Log in with itch.io to leave a comment.